How are Gambly's edges different (and better)?

Jonathan Bales
Jun 17, 2026 · Updated Jun 17, 2026
While Gambly doesn’t take a direct stance on games, we do calculate the edge–or expected ROI–for most bets.
Our edge calculations start with a comparison of the current line on a bet at any given sportsbook and the consensus or weighted average of market-making sportsbooks. For most bets, we then apply regression analysis to adjust fair odds based on factors such as historical ranges of outcomes to provide edges on a vast array of derivatives and alt markets.
The exact formula used to calculate each edge differs based on the bet type. Calculating edges for a main market is much different than for a player prop, which is much different than for a partial or alt.
At a high level:
Main Game Lines
-
Mostly the consensus of market-making books
-
Some data science to determine which books to weight for specific bets
Alts/Partials
-
Fair prices derived from main lines
-
Lots of data science to determine what a first-quarter total or an alt spread “should be” based on the main markets
Player Props
-
Weighted market average
-
Lots of data science to compare different point values; for example, comparing over 6.5 strikeouts to over 7.5 strikeouts with different associated moneylines
We don’t take a viewpoint on games outside of market data, meaning this approach is top-down and sport-agnostic. For example, if DraftKings has the odds of a certain event at -110 and all other books are at -120, it’s likely that DraftKings’ line is off. But not all sportsbooks are created equally–some are sharper than others–which is why we use a weighted combination of each market-making book’s historical accuracy to calculate what the actual vig-free line should be, or the true odds.
By comparing the current odds to a probable “true line” based on current market structure and historical data, it’s possible to calculate a bet’s expected ROI.
Ultimately, we're looking at:
- current market structure (the odds across all sportsbooks in real-time)
- historical accuracy of each sportsbook for each bet type
- regression analysis to determine fair value on derivatives and differing point totals (like comparing -6.5 (-110) to -7 (+105), for example, or calculating fair odds for a first-quarter total using the main markets)
One of the main benefits for which our approach allows is comparing apples to oranges. There’s a lot of work that goes into determining the fair price on an alt total of over 47.5 when the main line is 41.5 and the spread is 4.5, for example.
Most “EV scanners” do not appropriately account for different point values, but the reality is that the majority of non-main-market bets need to be adjusted for this. Is over 69.5 yards (-110) better, or over 74.5 yards (+110)? There’s an answer to questions like this, and we’ve put in a huge amount of time and energy with some very smart people to solve them.
Three Examples of How Gambly Calculates Edges
Looking at the example below, Gambly is showing an edge on the under for Justice Hill receptions at three sportsbooks: Hard Rock, BetMGM, and NoVig.
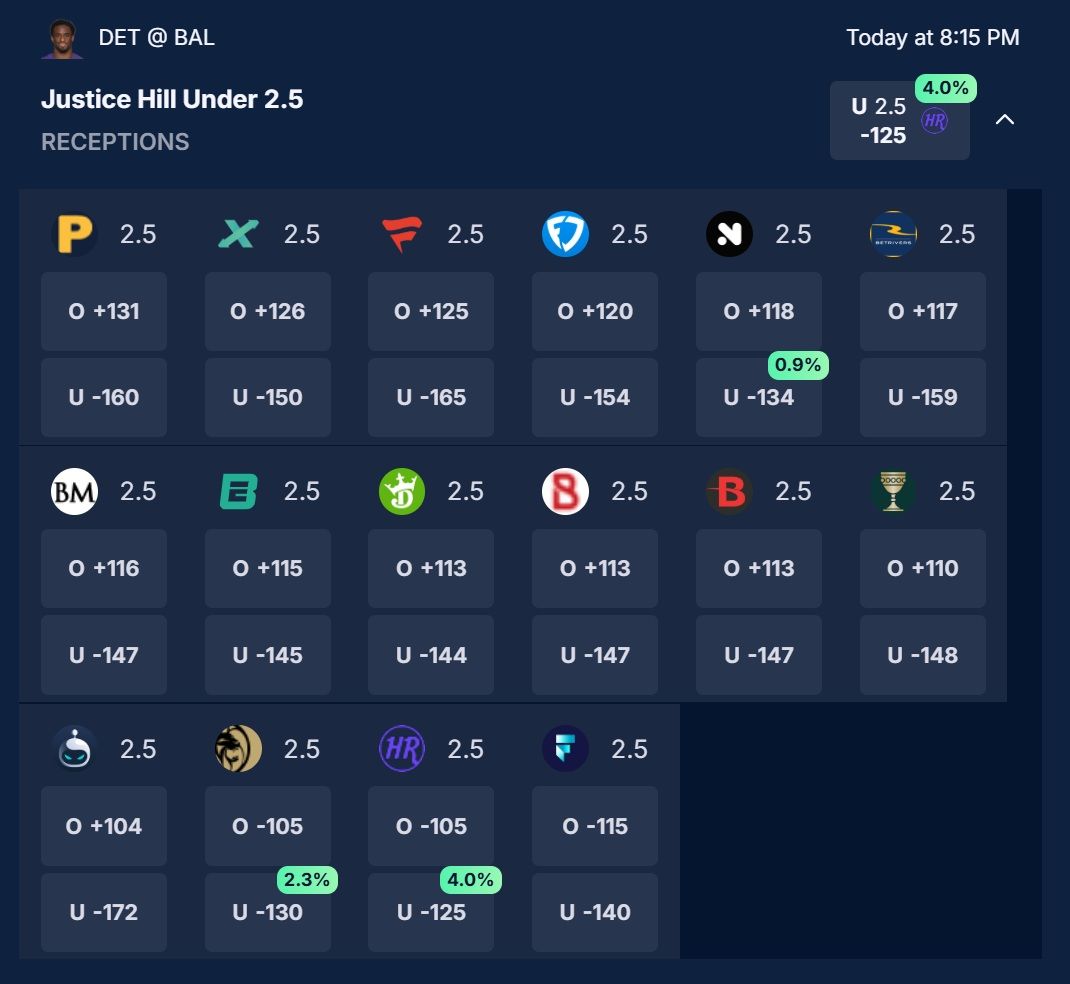
In this case, Gambly is analyzing the markets posted for Hill at every book and weighting a few market-making books heavier than others based on their historical accuracy for this bet type. FanDuel, for example, is on the sharper side for NFL player props, and is thus weighted more heavily than, say, ESPN Bet.
If we were to take solely FanDuel as our “source of truth” for this bet, the vig-free fair line based on their odds would be right around -133. This actually matches up closely with what we see, as we're calculating a true line around -137. MGM, Hard Rock, and NoVig are the only three books offering value at -134 or better.
But this one is easy. Every book has a total of 2.5 receptions, so it’s (relatively) simple to compare the moneylines in a straightforward way.
That’s usually not the case, such as with Rashod Bateman’s yardage props below.
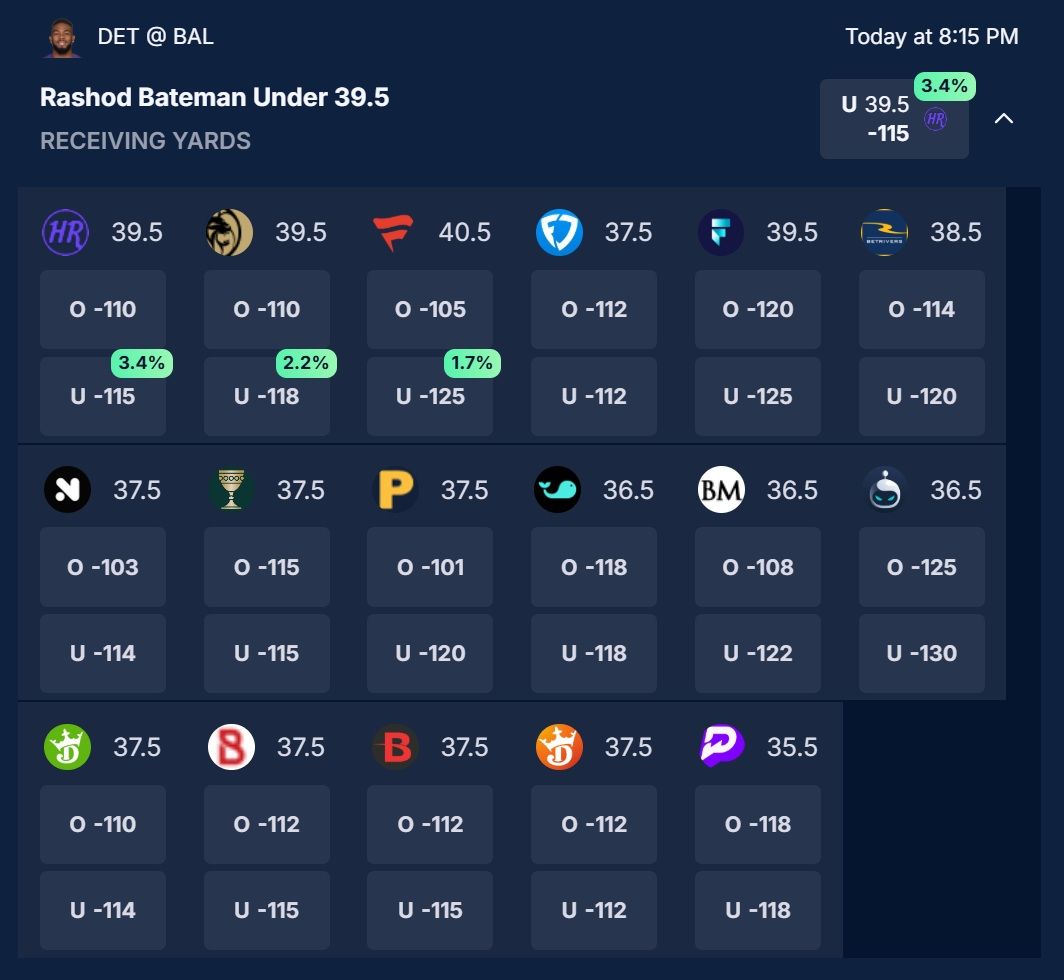
In this instance, Gambly is identifying an under 39.5 yards at Hard Rock as better than an under 40.5 yards at Fanatics because betting the former at -115 will lead to a superior ROI than getting an additional yard but needing to bet it at -125.
The ability to compare different point totals like this is what makes Gambly unique, and different from other +EV tools. These edges were found not just with a weighted market average of specific books, but with data science that can compare 39.5 yards to 40.5 yards or any other number.
The prop market doesn’t have a true “market maker,” but some books provide more signal than others. Here, FanDuel, Pinnacle, Bookmaker, and BetOnline all have a different point value than Hard Rock, for example, but Gambly allows you to compare apples to oranges.
We convert the 36.5 and 37.5 totals from the signal-providing books to a fair value at 39.5 yards, which in this case happens to be -124. When you compare the -115 on under 39.5 yards that Hard Rock is offering to the fair line of -124, you get a 3.4% edge.
In situations in which Gambly is mostly using a weighted market average to uncover value, you’ll rarely see more than a few sportsbooks with a positive ROI for a bet.
Most other times, Gambly uses a different process to calculate fair odds, such as with alt lines like that below.
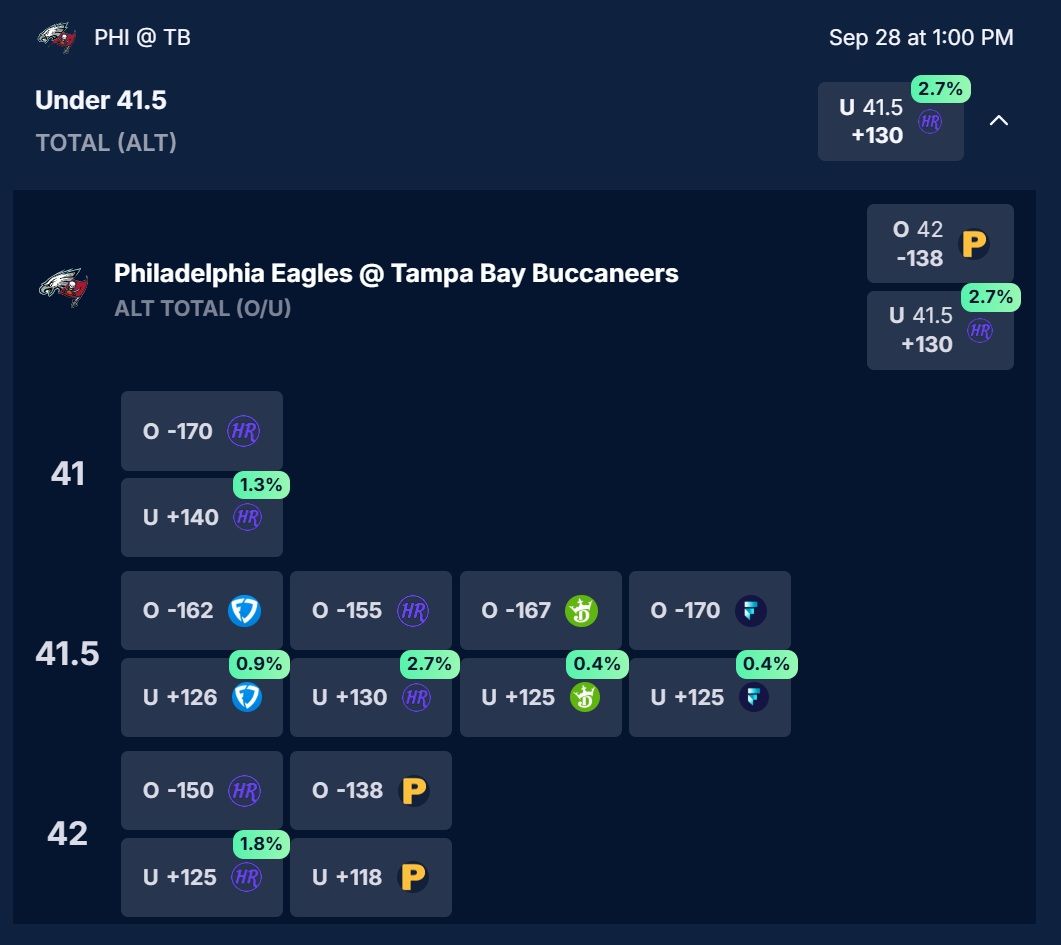
In this case, it’s possible to see every book on one side of a bet offer value, like we see on the under 41.5 here.
With most bets that are derivatives of a main market, such as alt totals, Gambly calculates fair odds on the main market first, rather than compare alt totals across books. The reason is that with so much more money bet into main markets, they’re far more likely to be accurate than partials, alts, and so on.
In this particular game, the total is 44.5 and the fair line on the Bucs is +3.5 (-115). Based on that information, it’s possible to use historical data to determine how often the game should end with a wide range of point totals, including below 41.5.
It turns out the fair price here for under 41.5 is around +124, meaning all books currently offering this alt total are pricing it too heavily in favor of the over.
Behind the scenes, there’s a host of factors that go into calculating the fair price for all types of bets.
Almost always, Gambly is first pricing main markets, then performing regression analysis with range-of-outcome data to accurately calculate the fair price of all sorts of derivatives–first-quarter bets, alt totals, milestone player props, and so on.
This allows us to compare different point totals and bet types in a way other EV screeners simply cannot do.
Why Gambly's Calculations Are So Valuable
Pricing derivatives like alts, partials, milestones, and so on can be quite difficult…
Should you bet an NFL favorite at -1 (-115) against the spread or at -125 on the moneyline? Should you bet a player over 68.5 yards at -110 or over 74.5 yards at +130? How do these answers change if the total is 38.5 versus 51.5?
When looking at alt markets, how do you know which of the many different spreads and totals is mathematically the best option?
Gambly provides you with the expected ROI on all bets, even if they have different point totals, letting you compare lines across different markets.
Comparing various forms of bets is essential to being profitable because nearly every bet offered is a derivative of a main market. Building these models to compare apples-to-oranges bets is extremely difficult but absolutely necessary to get the highest edge.
If you want to bet the over on Dak Prescott's passing yards, are you better off betting over 245.5 (-118) at Underdog or over 248.5 (-112) at DraftKings?
Even within a single sportsbook, you need to determine which alt lines are best. At DraftKings alone, I'm currently looking at 27 different milestone props for Prescott's passing yards. Maybe 260+ yards (+115) is best? Or is it 270+ yards (+143)? Or maybe it's actually 230+ yards (-176)?
The thing is, there's an answer to these questions, but it's a difficult one to uncover. We've put the resources into the data science behind these comparisons, so we know that if Prescott's median "true line" projection should be, say, 246 yards, then he has a certain knowable probability of going over 250 yards, 280 yards, and so on–based on a multitude of factors including historical range of outcomes, game specifics like the total and spread, etc.
The reality is that nearly every bet you make needs to be compared to other slightly different versions, and calculating which are best is an incredibly difficult task. We've put the time and energy into doing that–using real models built by pro bettors–which is what makes Gambly's edges unique. We're not treating 4.5-point and 5.5-point spreads the same. We're not treating over 243.5 yards as automatically better than over 247.5 yards just because the number is lower (it depends on the payout).
We're not just guessing.
There are lots of edge calculations out there. By and large, they make no such line adjustments (or, at best, inaccurate ones) because, simply put, it's very difficult to do. Gambly does the hard part for you.
The goal is to create pro-level tools that anyone can use. We hope to distill all the complexities of what goes on behind the scenes into straightforward numbers shown in an extremely simple-to-use app.
What's so great about top-down betting?
There are a multitude of ways to make profitable bets, all of which ultimately come down to determining the “fair price” for a bet and uncovering situations when sportsbooks are most off from that number.
Top-down betting is the optimal path for almost all bettors, though, because it allows one to leverage the cumulative knowledge of other smart bettors. When Pinnacle–a sharp sportsbook that takes action from the best gamblers–moves a line to -115 and DraftKings is still at even money, it signals that Pinnacle has information (likely from a sharp bettor) that signals even money at DraftKings is probably now a good bet.
The benefits of top-down betting include:
- Timeless–no need to continually update a model and worry if it’s still beating the market
- Ability to leverage the work of sharp bettors
- Far larger pool of available bets (albeit at a smaller edge)
- More bets, less bankroll variance
- A higher degree of confidence in being on the right side
- Can be used in combination with a bottom-up handicapping approach
The reality is that almost all bettors are better off starting with a top-down approach and then searching for the bets which are most intriguing to them based on personal factors, which is exactly what Gambly is built to help you do.
You can read more about why you should be top-down betting.
In a Nutshell
Gambly's edge calculations are among the most accurate you can find because of our commitment to data science and integrity.
We use real-time data.
We continually refine our process to improve our calculations.
We form accurate "true lines" based on many sport-specific data points.
We've put serious effort into building models to accurately compare apples-to-oranges bets in a way that others cannot do–such as knowing when to bet -7 vs. -6.5 or over 38.5 instead of over 38.
In a nutshell, we take a lot of pride in our edge calculations; the aim is to remove all of the complex and challenging work behind the scenes so you can make profitable bets as efficiently as possible.